There have been multiple accounts created with the sole purpose of posting advertisement posts or replies containing unsolicited advertising.

Accounts which solely post advertisements, or persistently post them may be terminated.

UnfortunateShort ,

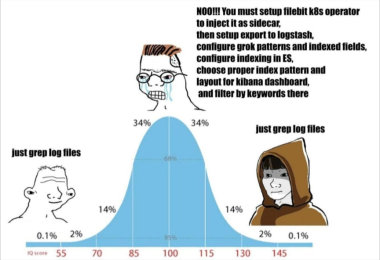
The middle thing is not what normies do, it is what enterprises do, because they have other needs than just knowing ‘error where?’

nik9000 ,

Do folks still use logstash here? Filebeat and ES gets you pretty far. I’ve never been deep in ops land though.

Tryptaminev ,

Please excuse my ignorance, but what is grep, what are the do’s and dont’s of logging and why are people here talking about having an entire team maintain some pipeline just to handle logs?

rodbiren ,

It’s a command line tool which filters for all lines containing the query. So something like

cat log.txt | grep Error5

Would output only lines containing Error5

porous_grey_matter ,

You can just do


<span style="color:#323232;">grep Error5 log.txt
</span>
biribiri11 ,

In the back of my mind I know this is there, but the cat | grep pattern is just muscle memory at this point

allywilson ,

I’ve been ‘told off’ so many times by the internet for my cat and grep combos that I still do it, then I remove the cat, it still works, and I feel better. shrug

expr ,

Just remember that if you aren’t actually concatenating files, cat is always unnecessary.

MehBlah ,

for me as well.

MehBlah ,

or if its a complex error cat log.txt|grep keyword1|grep keyword 2 and so on.

metaStatic ,

...or as I've come to call it grep+linux

RoadieRich ,

As someone who used to troubleshoot an extremely complex system for my day job, I can say I’ve worked my way across the entire bell curve.

Thcdenton ,

What the fuck is center even talking about? Is that shit a thing people do?

morbidcactus ,

A good chunk of it is relating to the elastic search stack, yeah it’s a thing people do.

wurstgulasch3000 ,

My life got so much better after we abandoned elasticsearch at work

douglasg14b ,
@douglasg14b@lemmy.world avatar

Yeah, ofc it is.

I’m working in a system that generates 750 MILLION non-debug log messages a day (And this isn’t even as many as others).

Good luck grepping that, or making heads or tails of what you need.

We put a lot of work into making the process of digging through logs easier. The absolute minimum we can do it dump it into elastic so it’s available in Kibana.

Similarly, in a K8 env you need to get logs off of your pods, ASAP, because pods are transient, disposable. There is no guarantee that a particular pod will live long enough to have introspectable logs on that particular instance (of course there is some log aggregation available in your environment that you could grep. But they actually usefulness of it is questionable especially if you don’t know what you need to grep for).

These are dozens, hundreds, more problems that crop up as you scale the number of systems and people working on those systems.

xavier666 ,

This write-up can be the next KRAZAM skit

xmunk ,

Why grep log files when I can instead force corporate to pay a fuck ton of money for a Splunk license.

krakenfury ,

It’s such an insane amount of money

TunaCowboy ,
Machindo ,

I’m running Grafana Loki for my company now and I’ll never go back to anything else. Loki acts like grep, is blazing fast and low maintenance. If it sounds like magic it kind is.


I saw this post and genuinely thought one of my teammates wrote it.

I had to manage an ELK stack and it was a full time job when we were supposed to be focusing on other important SRE work.

Then we switched to Loki + Grafana and it’s been amazing. Loki is literally k8s wide grep by default but then has an amazing query language for filtering and transforming logs into tables or even doing Prometheus style queries on top of a log query which gives you a graph.

Managing Loki is super simple because it makes the trade off of not indexing anything other than the kubernetes labels, which are always going to be the same regardless of the app. And retention is just a breeze since all the data is stored in a bucket and not on the cluster.

Sorry for gushing about Loki but I genuinely was that rage wojak before we switched. I am so much happier now.

JoMiran ,
@JoMiran@lemmy.ml avatar

We do Grafana + Prometheus for most of our clients but I think that adding Loki into the mix might be necessary. The amount of clients that are missing basic events like “you’ve run out of disk space…two days ago”, is too damn high.

dan ,
@dan@upvote.au avatar

The amount of clients that are missing basic events like "you’ve run out of disk space

For my personal servers, I use Netdata for this. Works pretty well.

UnsavoryMollusk ,

Still don’t know how to offset my time on the graph but besides that I find just complicated enough but not too much

Machindo ,

I would add Alertmanager to your stack if you haven’t already. It’s pretty tightly integrated with prometheus. There’s some canned alerting rules based on predicting disk space full in X number of days. We wire Alertmanager to Pagerduty.

jelloeater85 ,
@jelloeater85@lemmy.world avatar

Get DataDog if you can afford it. Shit magic. NewRelic is nice too, and cheaper. I used to use GreyLog and it was ok, Loki def was less work to maintain.

thirteene ,

Datadog logs are basically in beta. You can send them synthetics apm and rum but I would be interested in spinning up my own private greylog instance to get away from DD logs

jelloeater85 ,
@jelloeater85@lemmy.world avatar

I definitely don’t think they are in beta. What type of logs are you trying to get?

thirteene ,

It’s released but it’s insane feature light, has massive injestion problems, requires massive collection overhead and doesn’t have a fraction of splunks indexing. And it’s using the standard dd UI and I personally dont like. Logs aren’t metrics, they need a different interface.

DrM ,

Just using fluentd to push the files into an ElasticSearch DB and using Kibana as frontend is one day of work for a kubernetes admin and it works good enough (and way better than grepping logfiles from every of the 3000 pods running in a big cluster)

Tabitha ,

I needed to search something in the AWS log thing the other day, couldn’t figure out how to search text with one common non azAZ09-_ character, also couldn’t figure out how to negate on simple words, have to do the grep thing and it JustWorked™

themoonisacheese ,
@themoonisacheese@sh.itjust.works avatar

I used to work for a very very large company and there, a team of 9 people and I’s entire jobs was ensuring that the shitty qradar stack kept running (it did not want to do so). I would like to make abundantly clear that our job was not to use this stack at all, simply to keep it running. Using it was another team’s job.

NoneOfUrBusiness ,

Amazing. Depressing, but amazing.

Swedneck ,
@Swedneck@discuss.tchncs.de avatar

remember this shit when people talk about how we can’t just give people money for doing nothing

we’re already just inventing problems for people to fix so we can justify paying them

Hazzia ,

I’ve only ever grepped log files. 9 years into my career now so not sure which side of the spectrum I’m on (i’m definitely on the spectrum)

Magister ,
@Magister@lemmy.world avatar

I’m grepping log since the 80s/90s, still do

YerbaYerba ,

I have scripts to ssh and grep my logs across multiple VMs. Way faster than our crap Splunk instance. Pipe that shit through awk and I can find anything!

Damage ,

10 years give and take

Reddfugee42 ,

Well buddy, no need to be so greedy. Around here people just do a give or take, not both.

Damage ,

-10+10=0

Reddfugee42 ,

Well exactly. 10 years give and take means exactly 10 years. 10 years give OR take is a way to say it may be a little more or a little less.

Damage ,

Yeah then I can’t be greedy, I took exactly 0 years

Reddfugee42 ,

What about leap seconds?

mino ,
@mino@lemmy.ml avatar

Here we are all on the spectrum my friend.

9point6 ,

Good tracing & monitoring means you should basically never need to look at logs.

Pipe them all into a dumb S3 bucket with less than a week retention and grep away for that one time out of 1000 when you didn’t put enough info on the trace or fire enough metrics. Remove redundant logs that are covered by traces and metrics to keep costs down (or at least drop them to debug log level and only store info & up if they’re helpful during local dev).

DudeDudenson ,

What a nice world you must live in where all your code is perfectly clean, documented and properly tracked.

9point6 ,

Well I didn’t say anything about perfectly clean, but I agree, it’s very nice to work on my current projects which we’ve set up our observability to modern standards when compared to any of the log vomiting services I’ve worked on in the past.

Obviously easier to start with everything set up nicely in a Greenfield project, but don’t let perfect be the enemy of good—iterative improvements on badly designed observability nearly always pays off.

Skydancer ,

And not subject to compliance based retention standards

marcos ,

“Log” is the name of the place you write your tracing information into.

DmMacniel ,

Hmm but Kibana makes it easier to read and parse logs. And you don’t need server permissions to do it.

DudeDudenson ,

I’m not sure if you’re serious or not.

At my job they unilaterally decided that we no longer had access to our application logs in any way other than a single company wide grafana with no access control (which means anyone can see anything and seeing the stats and logs of only your stuff is a PITA).

Half the time the relevant log línes straight up don’t show up unless you use a explicit search for their content (good luck finding relevant information for an unknown error) and you’re extremely limited in how many log línes you can see at once.

Not to mention that none of our applications were designed with this platform in mind so all the logging is done in a legacy way that conforms to the idea of just grepping a log file and there’s no way the sponsors will commit to letting us spend weeks adjusting our legacy applications to actually log in a way that is useful for viewing in grafana and not a complete shitshow.

I’ve worked with a logstash/elastic/kibana stack for years before this job and I can tell you these solutions aren’t meant for seeing lines one by one or context searches (where seeing what happened right before and after matters a lot), they’re meant for aggregations and analysis.

It’s like moving all your stuff from one house to another in a tiny electric car. Sure technically it can be done but that’s not it’s purpose at all and good luck moving your fridge.

TigrisMorte ,

And in the two prior posts, children, we can see the difference between trained and experienced.

Evotech ,

You can easily access raw live output from any source in kibana if you want to for observability

thesmokingman ,

Are you sure it was set up correctly before? Kibana is the tool I’ve provisioned for dev log access for years so I don’t have to give them k8s perms. I have trained teams on debugging via Kibana and used Kibana myself for figuring out where prod errors were happening.

Your first paragraph is super shitty devX. That’s not okay. Your penultimate paragraph is really what I’m asking about.

douglasg14b ,
@douglasg14b@lemmy.world avatar

Ok…

So your point is that a bad logging implementation is bad. And I agree.

I’m not seeing how that’s extendable to implementations as a whole. You’re conflating your bad experience with "log aggregation is bad’.

Just because your company sucks at this doesn’t mean everyone else’s does.

velox_vulnus ,

grep -nr <pattern>, thank me later.

dohpaz42 ,
@dohpaz42@lemmy.world avatar

I’d also add -H when grep’ing multiple files and –color if your terminal supports it.

velox_vulnus ,

The world has become monochromatic for me, so no –color for me.

doomer_wojak

dohpaz42 ,
@dohpaz42@lemmy.world avatar

I’m not at a terminal right meow, but I believe it also bolds the found term(s). So there’s that, maybe?

  • All
  • Subscribed
  • Moderated
  • Favorites
  • [email protected]
  • random
  • lifeLocal
  • goranko
  • All magazines